US native plant species distributions at 240m scale
A new state of the art: more accurate than SINR, iNaturalist, BIEN and Daru 2024, PNAS on the same independent field plots, with maps 75x finer than Daru's.
01Findings
- State of the art on independent field plots. Median AUC 0.964 against 0.951 for SINR, the strongest published model, retrained; higher in 79% of 4,282 paired tests.
- Ahead of every other published map. Higher in 85–98% of paired tests against SINR's released models, iNaturalist, BIEN and Daru (2024).
- Also far from any record. Beyond 10 km from a species' records: 0.939 against 0.924 for SINR, higher in 71% of 4,131 tests.
- Each step of the method adds accuracy. On the same 88 tests: Daru's published maps 0.905, his method at 240 m 0.919, trained on real records 0.940, one joint model 0.969.
- One model for all 16,942 species. Beats MaxEnt fitted to each species (0.963 vs 0.934, 92% of 2,251 tests) and maps 494 species without records.
- Rare species borrow from their relatives. With 5 records, a species scores 0.927 against 0.895 for MaxEnt on the same records (higher for 73% of 725 species).
- All maps in 9.8 GB. About 19× smaller than per-species GeoTIFFs, with negligible loss: median AUC changes by 0.0011.
- Fast. All 16,448 species fitted in 1848 seconds on one GPU, once the shared representation is learned (55 minutes).
02Model comparison
Every published model, the same plots
Validated on independent field plots. Every comparison is paired: one test is one species on one plot source, scored for both models.
Choose a species
Larrea tridentata Creosote Bushphoto © larivera, some rights reserved (CC BY-NC)
Uniola paniculata Sea Oatsphoto © Alex Abair, some rights reserved (CC BY)
Goodyera tesselata Checkered Rattlesnake Plantainphoto © John Boldt, some rights reserved (CC BY-NC)
Eriophyllum lanatum Common Woolly Sunflowerphoto © p38, some rights reserved (CC BY-NC)
Silene virginica Fire Pinkphoto © ravenclagg5, some rights reserved (CC BY-NC)
a DeepEarth (ours)
AUC VegBank 0.996 · AIM 0.990AUC VegBank 0.997AUC VegBank 0.990AUC VegBank 0.922 · AIM 0.855AUC VegBank 0.960

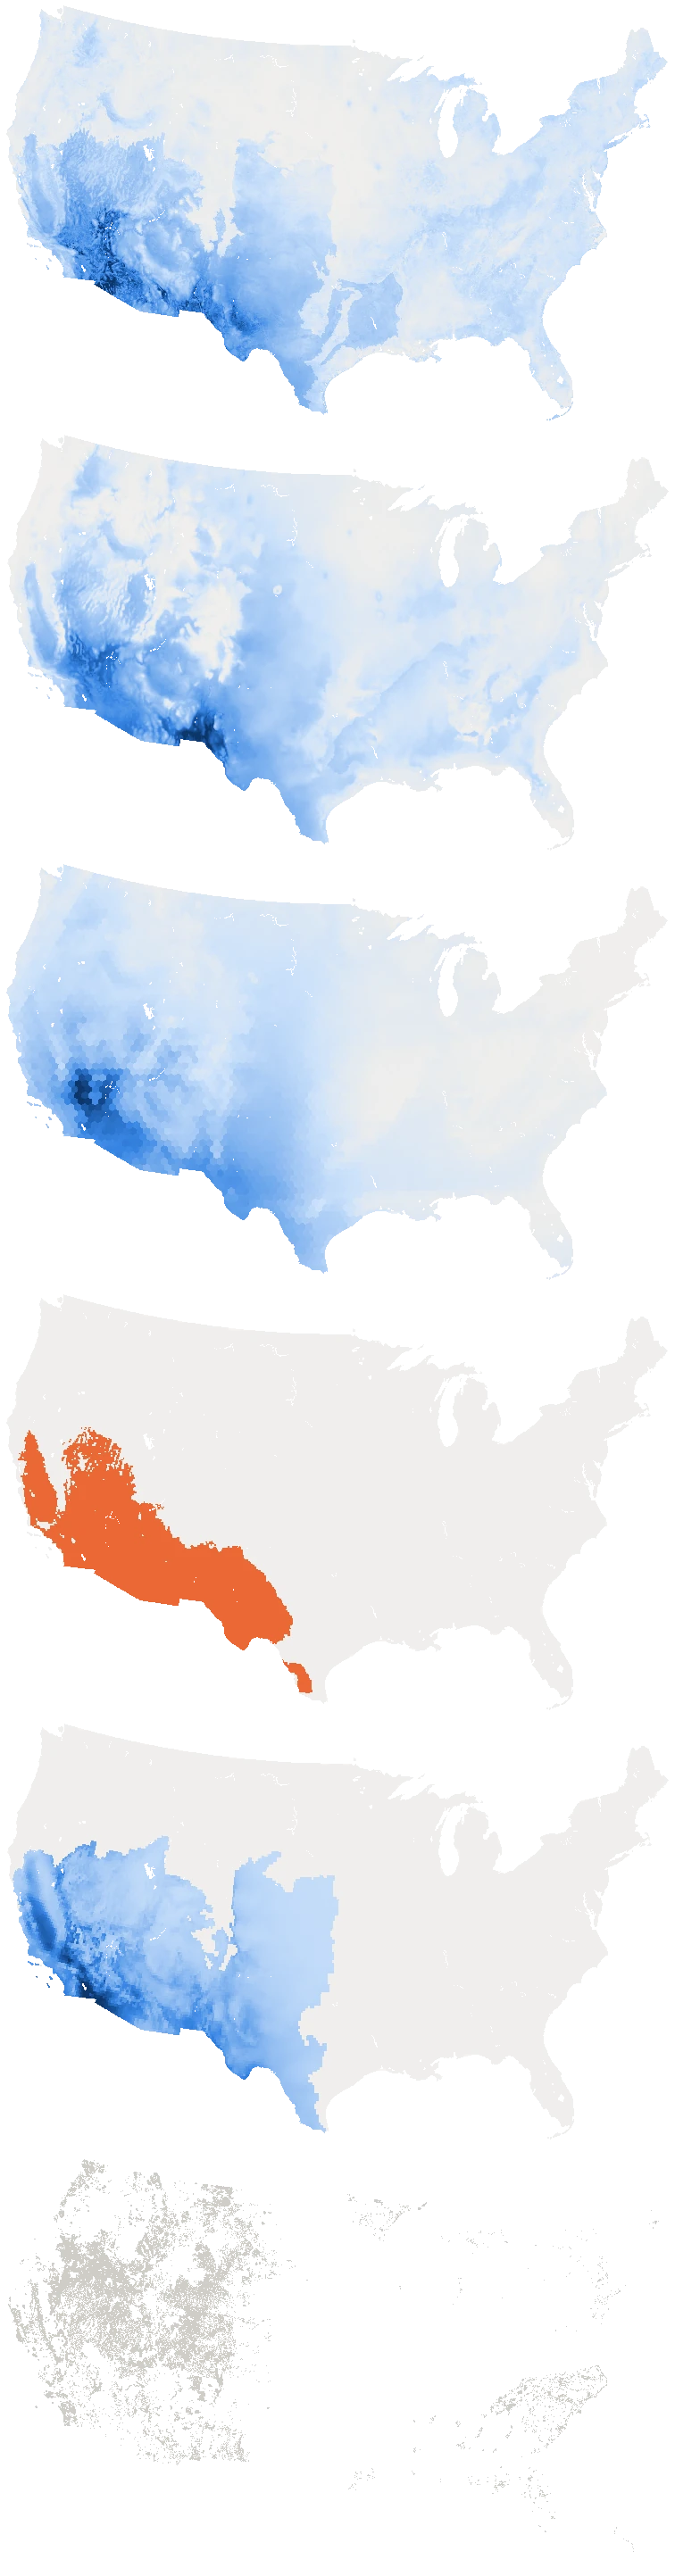
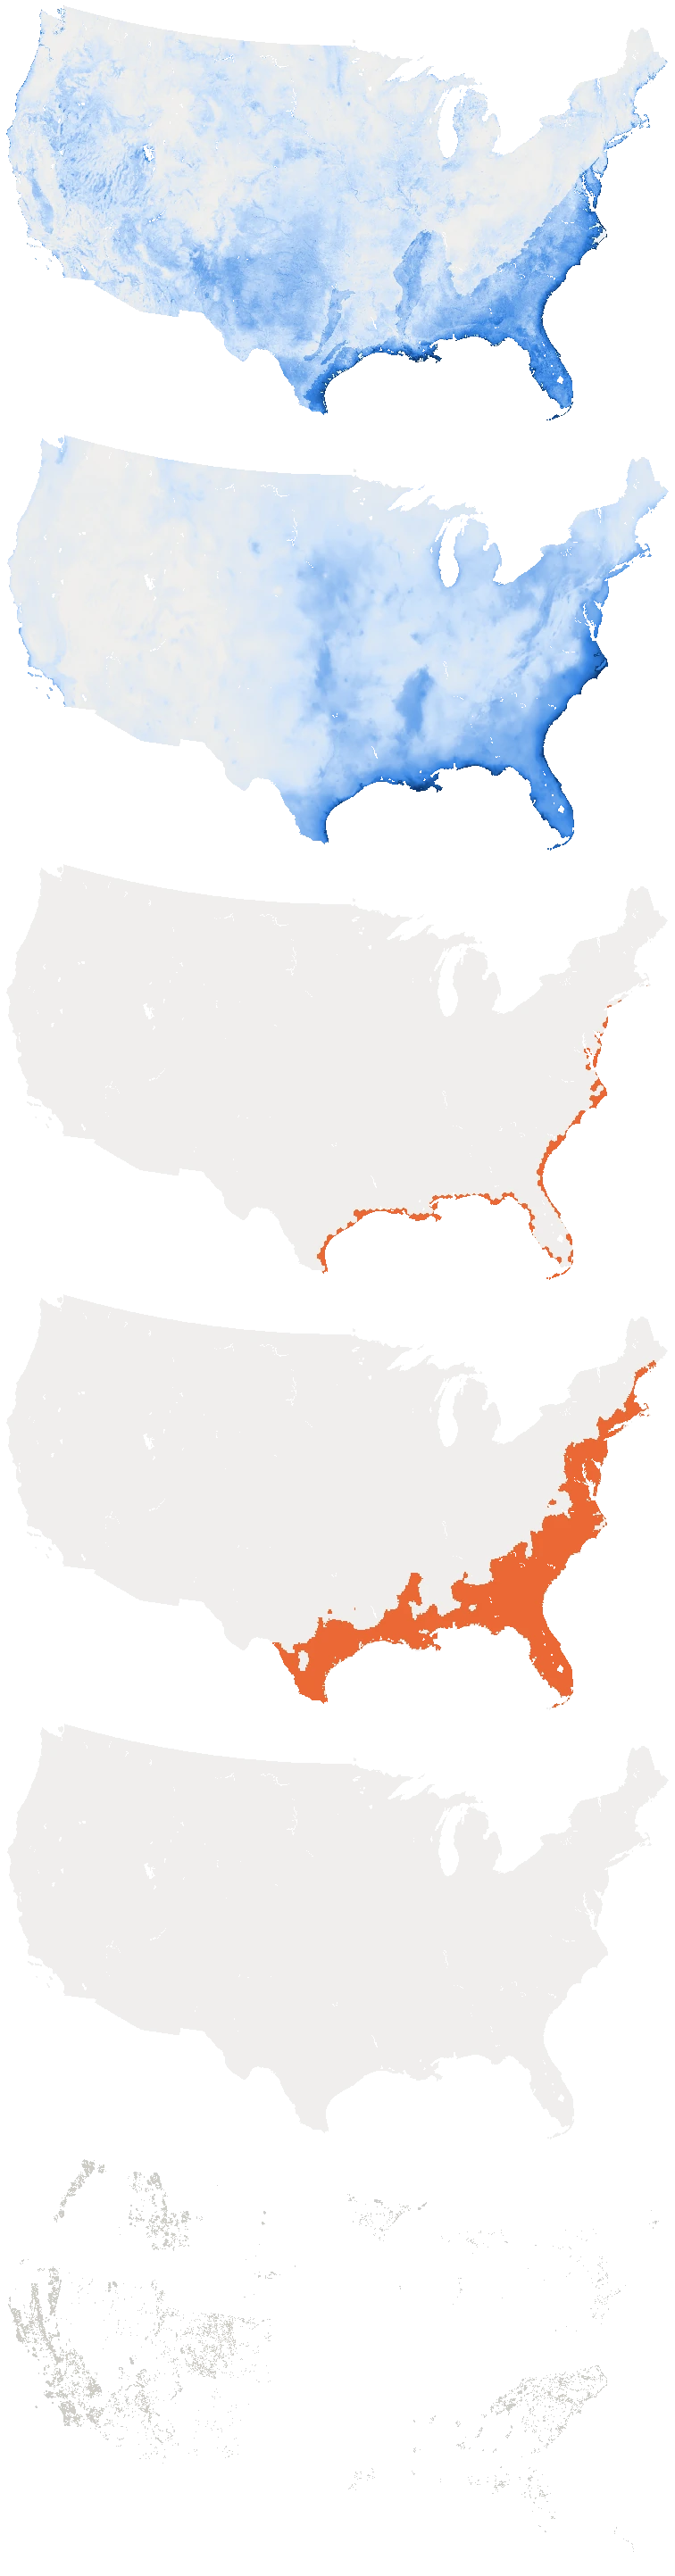
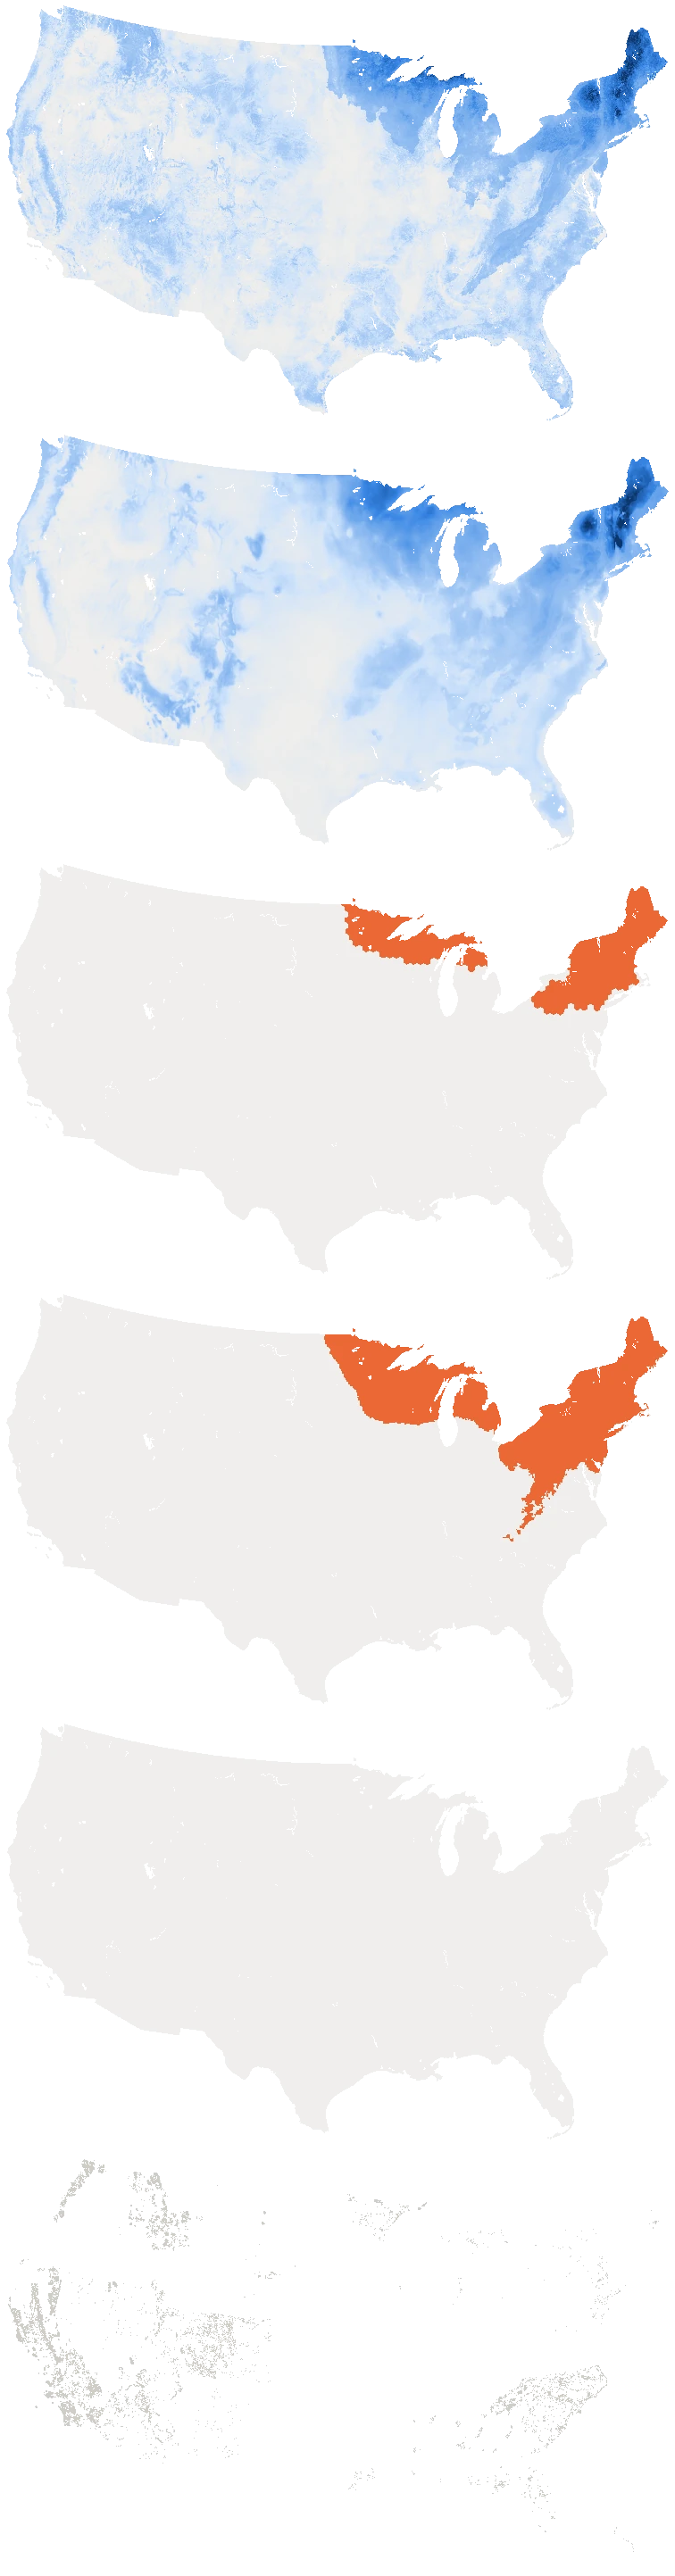
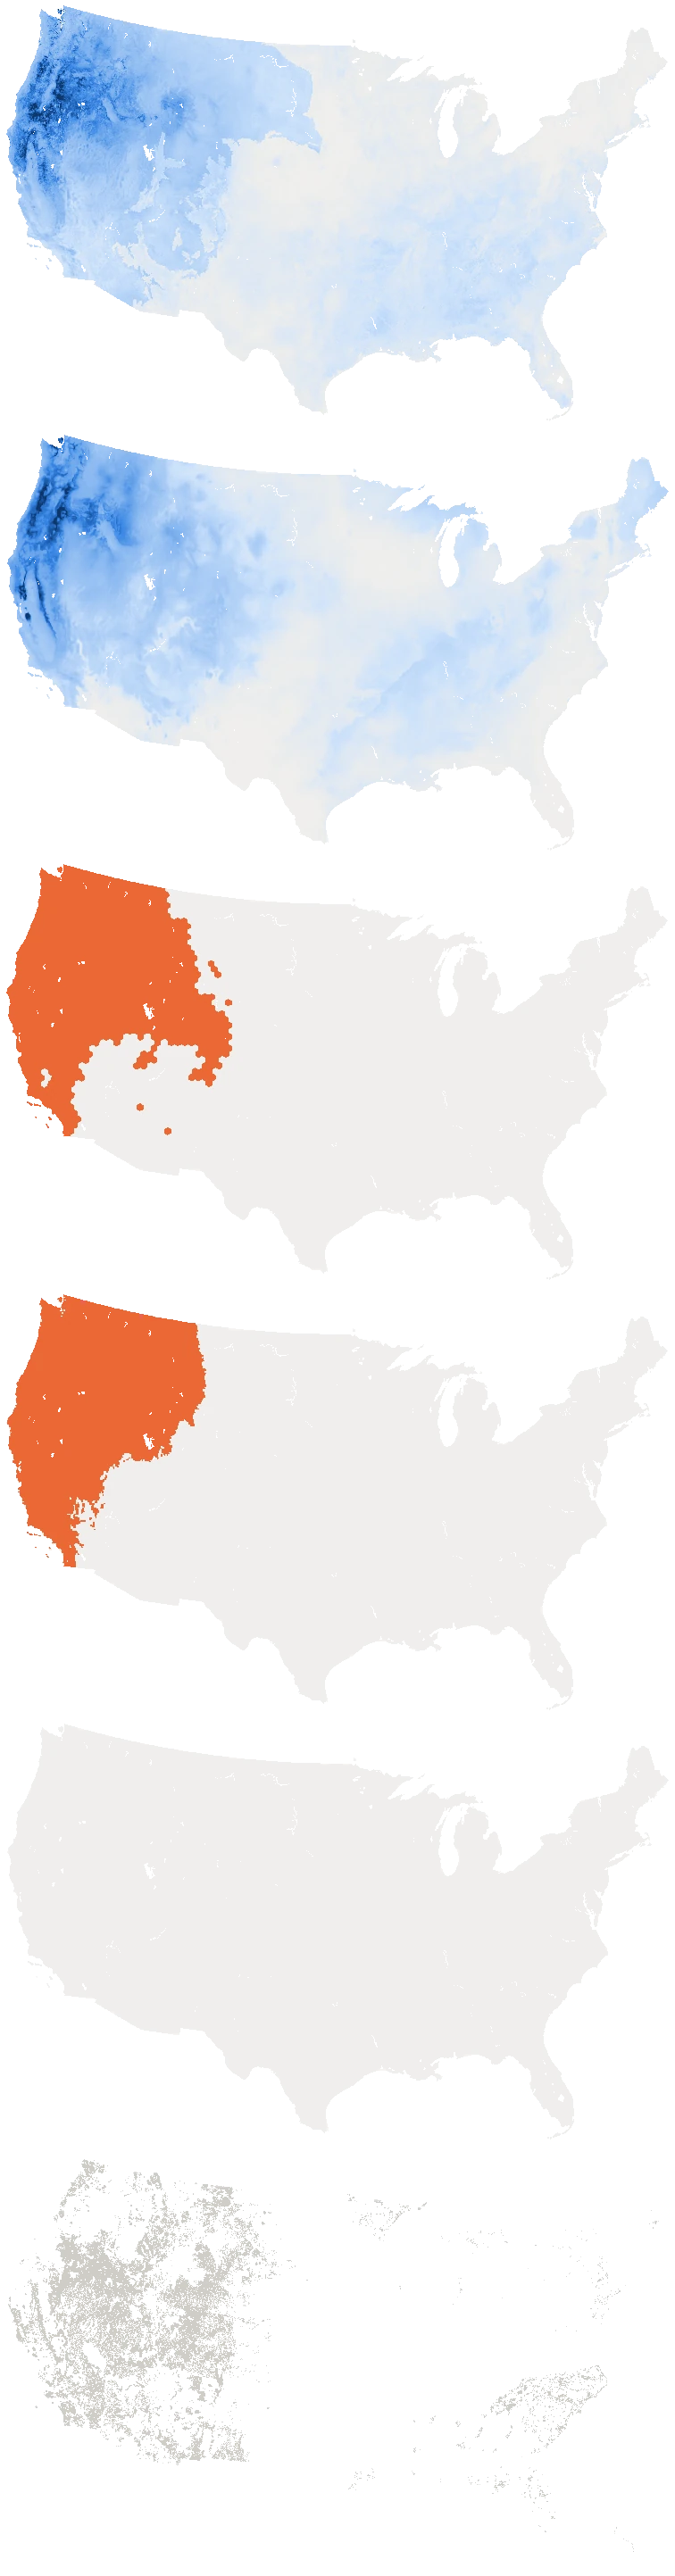
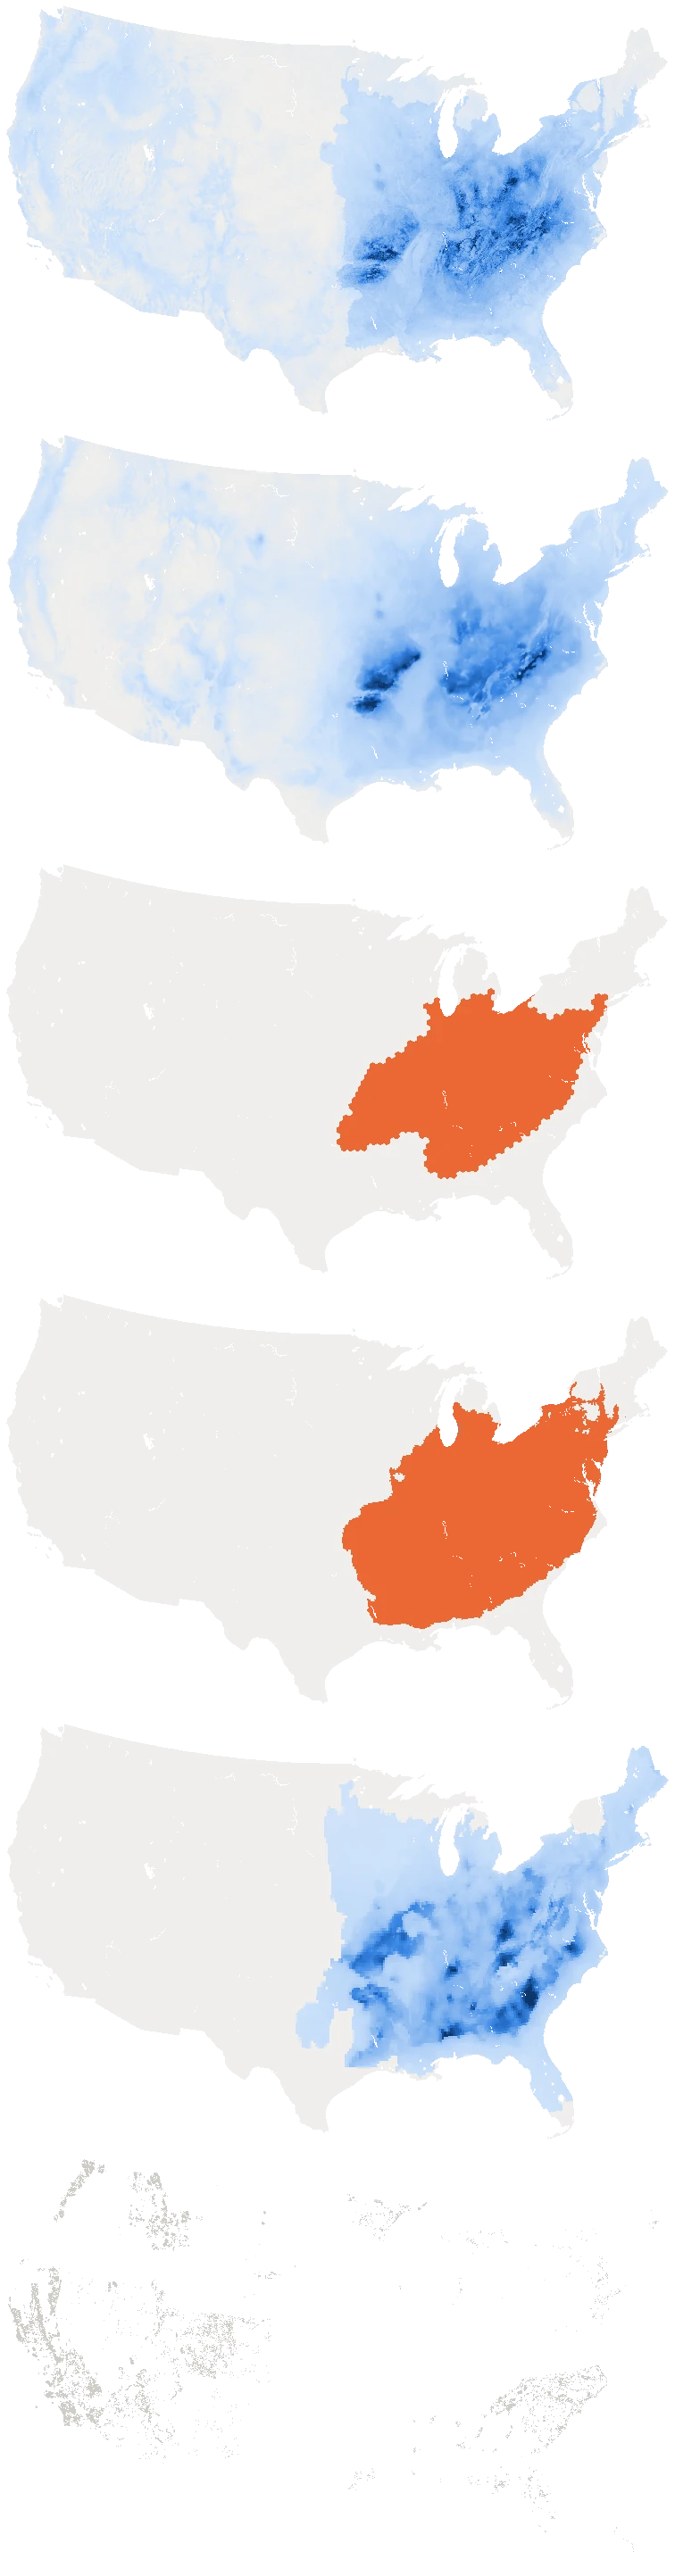

 DeepEarth (ours) map of Larrea tridentataDeepEarth (ours) map of Uniola paniculataDeepEarth (ours) map of Goodyera tesselataDeepEarth (ours) map of Eriophyllum lanatumDeepEarth (ours) map of Silene virginica, open full screen
b SINR (coordinates + environment)
AUC VegBank 0.991 · AIM 0.986AUC VegBank 0.996AUC VegBank 0.991AUC VegBank 0.896 · AIM 0.869AUC VegBank 0.931
SINR (coordinates + environment) map of Larrea tridentataSINR (coordinates + environment) map of Uniola paniculataSINR (coordinates + environment) map of Goodyera tesselataSINR (coordinates + environment) map of Eriophyllum lanatumSINR (coordinates + environment) map of Silene virginica, open full screen
c iNaturalist geomodel
released weights · AUC VegBank 0.990 · AIM 0.989Open Range Map (binary) · AUC VegBank 0.964Open Range Map (binary) · AUC VegBank 0.986Open Range Map (binary) · AUC VegBank 0.678 · AIM 0.672Open Range Map (binary) · AUC VegBank 0.926
iNaturalist geomodel map of Larrea tridentataiNaturalist geomodel map of Uniola paniculataiNaturalist geomodel map of Goodyera tesselataiNaturalist geomodel map of Eriophyllum lanatumiNaturalist geomodel map of Silene virginica, open full screen
d BIEN range
polygon (binary) · AUC VegBank 0.849† · AIM 0.916polygon (binary) · AUC VegBank 0.619†polygon (binary) · AUC VegBank 0.979†polygon (binary) · AUC VegBank 0.700† · AIM 0.739polygon (binary) · AUC VegBank 0.920†
BIEN range map of Larrea tridentataBIEN range map of Uniola paniculataBIEN range map of Goodyera tesselataBIEN range map of Eriophyllum lanatumBIEN range map of Silene virginica, open full screen
e Daru et al. 2024
published MaxEnt · AUC VegBank 0.897 · AIM 0.924published MaxEnt · species not availablepublished MaxEnt · species not availablepublished MaxEnt · species not availablepublished MaxEnt · AUC VegBank 0.962
Not available
no published map in the Dryad extract (557 species)
Not available
no published map in the Dryad extract (557 species)
Not available
no published map in the Dryad extract (557 species)
Daru et al. 2024 map of Larrea tridentataDaru et al. 2024 map of Uniola paniculataDaru et al. 2024 map of Goodyera tesselataDaru et al. 2024 map of Eriophyllum lanatumDaru et al. 2024 map of Silene virginica, open full screen
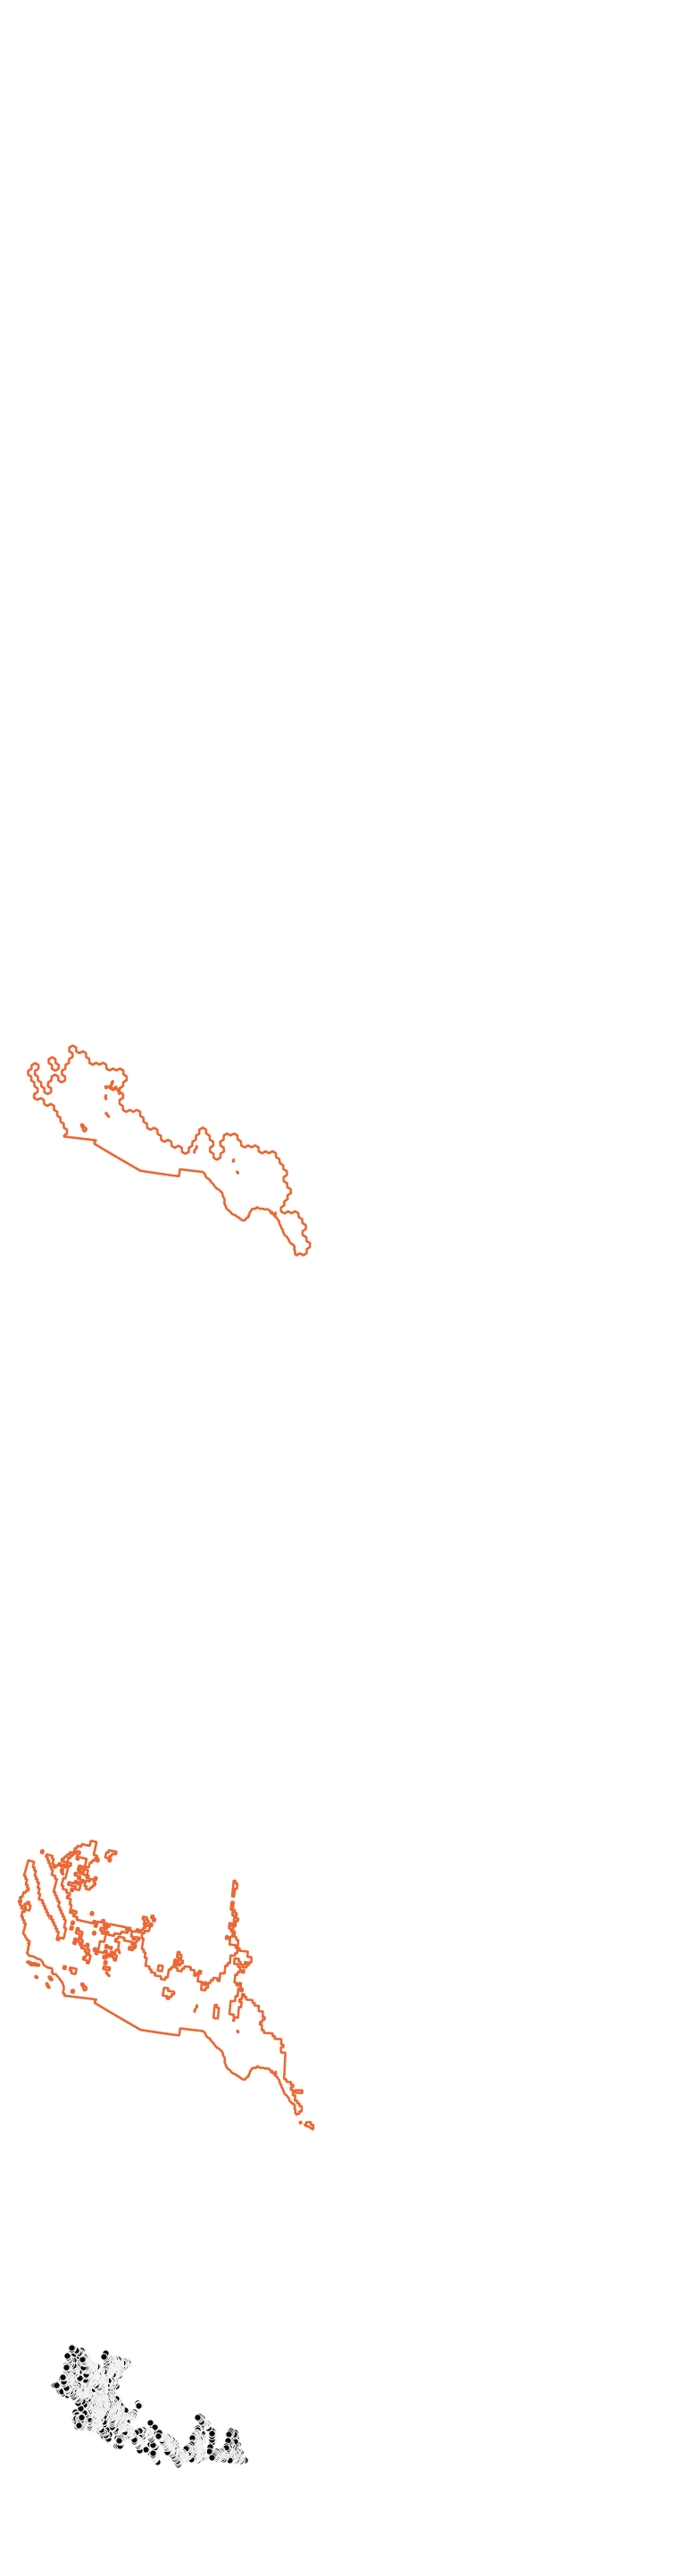
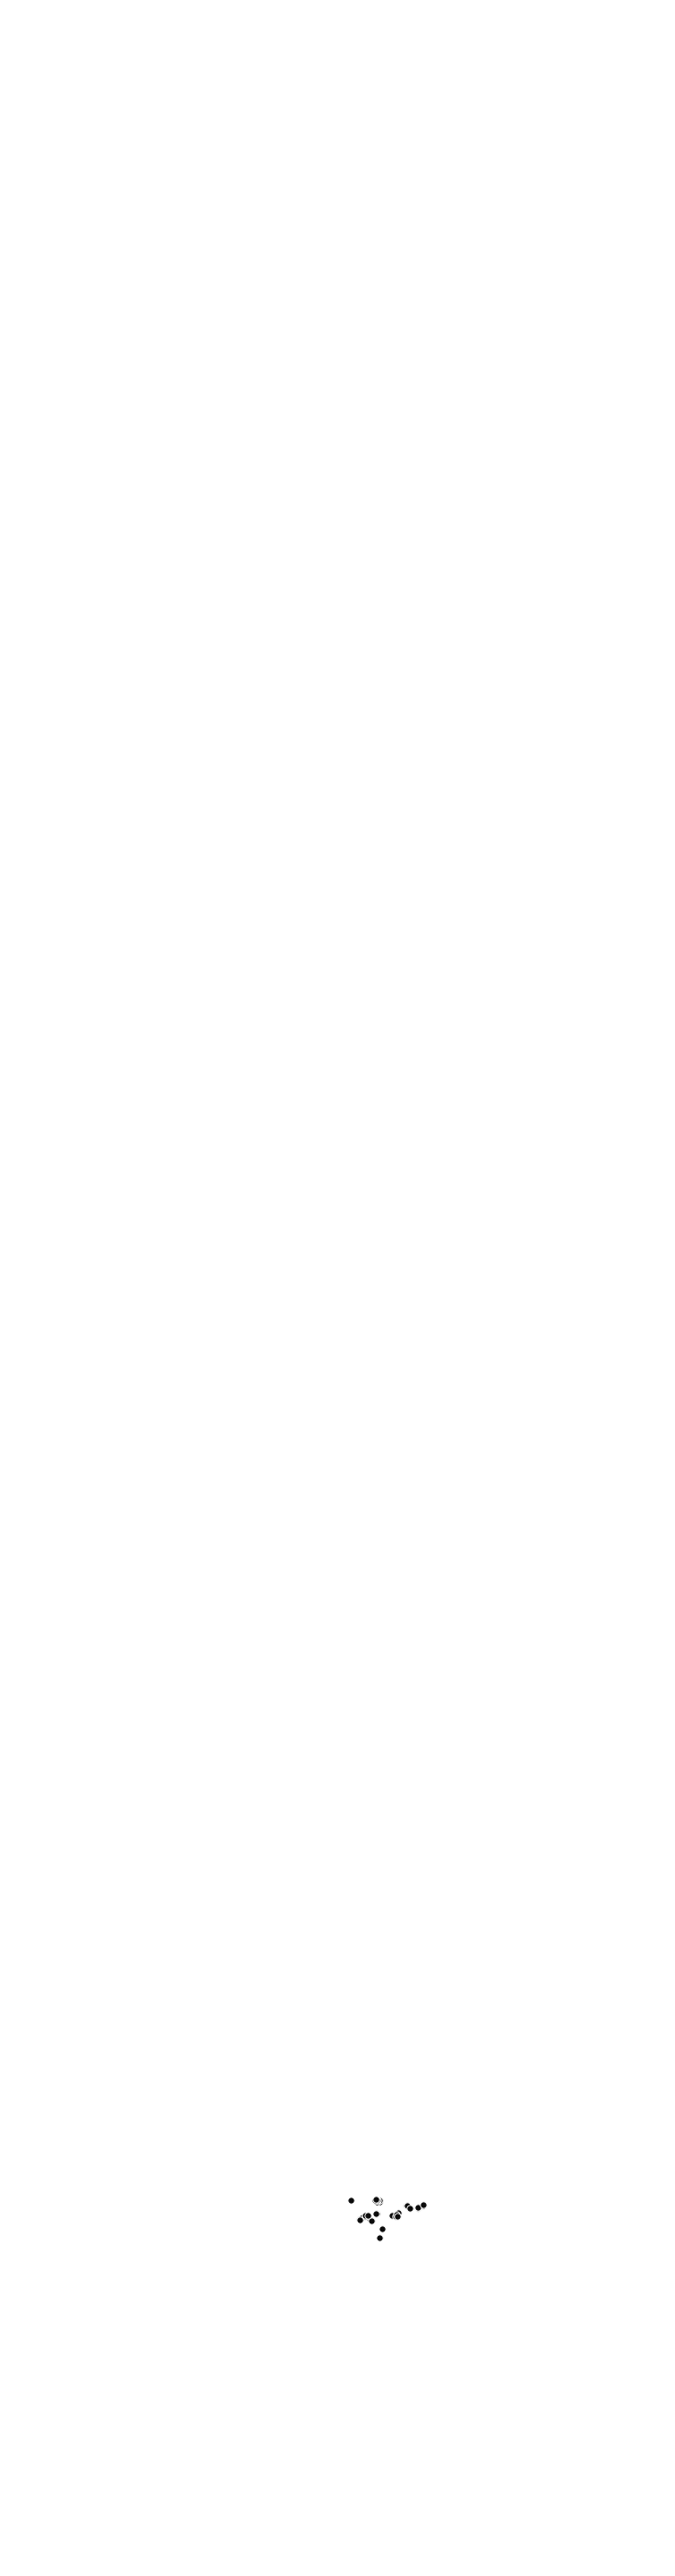
f Evidence: survey plots
7,508 presences · 117,345 absences (VegBank · AIM)124 presences · 53,673 absences (VegBank)80 presences · 53,717 absences (VegBank)1,529 presences · 123,324 absences (VegBank · AIM)55 presences · 53,742 absences (VegBank)
Evidence: survey plots map of Larrea tridentataEvidence: survey plots map of Uniola paniculataEvidence: survey plots map of Goodyera tesselataEvidence: survey plots map of Eriophyllum lanatumEvidence: survey plots map of Silene virginica, open full screen
Continuous models: score rank within CONUS land (top share)
- Binary range (inside)
- Published binary range outline
- Presence plot
- Absence plot
| Model | All plots | VegBank | BLM AIM | USFS FIA | > 10 kmfrom records |
|---|---|---|---|---|---|
| SINR (coordinates + environment)Cole et al. 2023; retrained, strongest configuration | 0.964 / 0.95179% · 4,282 | 0.969 / 0.95782% · 2,750 | 0.944 / 0.92775% · 1,281 | 0.957 / 0.95071% · 251 | 0.939 / 0.92471% · 4,131 |
| SINR (coordinates)released model | 0.964 / 0.94385% · 4,282 | 0.969 / 0.95187% · 2,750 | 0.944 / 0.90881% · 1,281 | 0.957 / 0.94380% · 251 | 0.939 / 0.91674% · 4,131 |
| SINR (distilled)released model | 0.964 / 0.93985% · 4,282 | 0.969 / 0.94488% · 2,750 | 0.944 / 0.91278% · 1,281 | 0.957 / 0.94678% · 251 | 0.939 / 0.91872% · 4,131 |
| iNaturalist geomodelreleased weights; continuous | 0.933 / 0.87594% · 125 | 0.943 / 0.89196% · 79 | 0.922 / 0.81379% · 24 | 0.874 / 0.834100% · 22 | 0.912 / 0.85093% · 125 |
| iNaturalist range mapsOpen Range Maps; binary | 0.963 / 0.87498% · 5,378 | 0.970 / 0.89199% · 3,344 | 0.940 / 0.81298% · 1,775 | 0.955 / 0.86499% · 259 | 0.938 / 0.84394% · 5,197 |
| BIEN range mapsbinary; built partly from VegBank and FIA plots | 0.937 / 0.74398% · 1,854 | 0.969 / 0.841not independent | 0.937 / 0.74398% · 1,854 | 0.956 / 0.861not independent | 0.909 / 0.72396% · 1,850 |
| Daru's method at 240 mDaru (2024) MaxEnt recipe re-fitted at 240 m on the same plots | 0.964 / 0.90396% · 1,842 | 0.968 / 0.90997% · 1,289 | 0.945 / 0.83694% · 363 | 0.946 / 0.90097% · 190 | 0.939 / 0.87987% · 1,769 |
| Daru (2024)published maps, ~18 km | 0.961 / 0.89795% · 259 | 0.971 / 0.91596% · 141 | 0.938 / 0.84594% · 104 | 0.972 / 0.915100% · 14 | 0.931 / 0.87885% · 255 |
Median AUC, DeepEarth / published model; below, the share of paired tests DeepEarth wins and their number. BIEN on BLM AIM plots only (its ranges used VegBank and FIA plots). Shaded: not significant (Wilcoxon, p ≥ 0.05).
Each step of the method
Daru's published maps, his method rebuilt at 240 m, MaxEnt trained on real records, and the joint model, on the same species and plots.
VegBank, BLM AIM and USFS FIA plots together · 88 species–plot-source pairs
Ecological Society of America vegetation plot archive, US-wide · 58 species
Bureau of Land Management vegetation monitoring plots, arid West · 19 species
US Forest Service forest inventory plots (trees) · 11 species
| Model | All plots88 | VegBank58 | BLM AIM19 | USFS FIA11 |
|---|---|---|---|---|
| Daru (2024)published · ~18 km | 0.905 | 0.905 | 0.870 | 0.911 |
| Daru's method240 m | 0.919 | 0.927 | 0.892 | 0.914 |
| MaxEnt per speciesoccurrences · 240 m | 0.940 | 0.941 | 0.933 | 0.917 |
| DeepEarthjoint model · 240 m | 0.969 | 0.964 | 0.972 | 0.970 |
Species with at least 20 presence plots and all four maps; n under each source.
More results
Every paired test against every published model. Medians, the share of tests DeepEarth wins and the Wilcoxon p-value, on all plots and on plots far from records.
| Model | Plots | Tests | DeepEarth | Model | Higher for | p |
|---|---|---|---|---|---|---|
| SINR (coordinates + environment) | All plots | 4,282 | 0.964 | 0.951 | 79% | < 10−300 |
| VegBank | 2,750 | 0.969 | 0.957 | 82% | < 10−242 | |
| BLM AIM | 1,281 | 0.944 | 0.927 | 75% | < 10−68 | |
| USFS FIA | 251 | 0.957 | 0.950 | 71% | < 10−11 | |
| All plots, > 10 km from records | 4,131 | 0.939 | 0.924 | 71% | < 10−163 | |
| VegBank, > 10 km | 2,605 | 0.946 | 0.930 | 72% | < 10−114 | |
| BLM AIM, > 10 km | 1,276 | 0.914 | 0.896 | 70% | < 10−45 | |
| USFS FIA, > 10 km | 250 | 0.940 | 0.937 | 71% | < 10−7 | |
| SINR (coordinates) | All plots | 4,282 | 0.964 | 0.943 | 85% | < 10−300 |
| VegBank | 2,750 | 0.969 | 0.951 | 87% | < 10−300 | |
| BLM AIM | 1,281 | 0.944 | 0.908 | 81% | < 10−107 | |
| USFS FIA | 251 | 0.957 | 0.943 | 80% | < 10−19 | |
| All plots, > 10 km from records | 4,131 | 0.939 | 0.916 | 74% | < 10−230 | |
| VegBank, > 10 km | 2,605 | 0.946 | 0.925 | 76% | < 10−157 | |
| BLM AIM, > 10 km | 1,276 | 0.914 | 0.879 | 72% | < 10−67 | |
| USFS FIA, > 10 km | 250 | 0.940 | 0.932 | 74% | < 10−11 | |
| SINR (distilled) | All plots | 4,282 | 0.964 | 0.939 | 85% | < 10−300 |
| VegBank | 2,750 | 0.969 | 0.944 | 88% | < 10−300 | |
| BLM AIM | 1,281 | 0.944 | 0.912 | 78% | < 10−88 | |
| USFS FIA | 251 | 0.957 | 0.946 | 78% | < 10−15 | |
| All plots, > 10 km from records | 4,131 | 0.939 | 0.918 | 72% | < 10−186 | |
| VegBank, > 10 km | 2,605 | 0.946 | 0.925 | 75% | < 10−142 | |
| BLM AIM, > 10 km | 1,276 | 0.914 | 0.888 | 68% | < 10−46 | |
| USFS FIA, > 10 km | 250 | 0.940 | 0.940 | 62% | < 10−4 | |
| iNaturalist geomodel | All plots | 125 | 0.933 | 0.875 | 94% | < 10−16 |
| VegBank | 79 | 0.943 | 0.891 | 96% | < 10−12 | |
| BLM AIM | 24 | 0.922 | 0.813 | 79% | 0.0039 | |
| USFS FIA | 22 | 0.874 | 0.834 | 100% | < 10−6 | |
| All plots, > 10 km from records | 125 | 0.912 | 0.850 | 93% | < 10−15 | |
| VegBank, > 10 km | 79 | 0.928 | 0.871 | 95% | < 10−11 | |
| BLM AIM, > 10 km | 24 | 0.903 | 0.809 | 79% | 0.0048 | |
| USFS FIA, > 10 km | 22 | 0.852 | 0.815 | 100% | < 10−6 | |
| iNaturalist range maps | All plots | 5,378 | 0.963 | 0.874 | 98% | < 10−300 |
| VegBank | 3,344 | 0.970 | 0.891 | 99% | < 10−300 | |
| BLM AIM | 1,775 | 0.940 | 0.812 | 98% | < 10−276 | |
| USFS FIA | 259 | 0.955 | 0.864 | 99% | < 10−43 | |
| All plots, > 10 km from records | 5,197 | 0.938 | 0.843 | 94% | < 10−300 | |
| VegBank, > 10 km | 3,169 | 0.948 | 0.874 | 93% | < 10−300 | |
| BLM AIM, > 10 km | 1,770 | 0.910 | 0.772 | 96% | < 10−268 | |
| USFS FIA, > 10 km | 258 | 0.938 | 0.848 | 98% | < 10−40 | |
| BIEN range maps | All plots | 1,854 | 0.937 | 0.743 | 98% | < 10−294 |
| BLM AIM | 1,854 | 0.937 | 0.743 | 98% | < 10−294 | |
| All plots, > 10 km from records | 1,850 | 0.909 | 0.723 | 96% | < 10−283 | |
| BLM AIM, > 10 km | 1,850 | 0.909 | 0.723 | 96% | < 10−283 | |
| Daru's method at 240 m | All plots | 1,842 | 0.964 | 0.903 | 96% | < 10−284 |
| VegBank | 1,289 | 0.968 | 0.909 | 97% | < 10−204 | |
| BLM AIM | 363 | 0.945 | 0.836 | 94% | < 10−52 | |
| USFS FIA | 190 | 0.946 | 0.900 | 97% | < 10−30 | |
| All plots, > 10 km from records | 1,769 | 0.939 | 0.879 | 87% | < 10−205 | |
| VegBank, > 10 km | 1,219 | 0.946 | 0.890 | 85% | < 10−135 | |
| BLM AIM, > 10 km | 361 | 0.911 | 0.808 | 90% | < 10−45 | |
| USFS FIA, > 10 km | 189 | 0.928 | 0.879 | 94% | < 10−27 | |
| Daru (2024) | All plots | 259 | 0.961 | 0.897 | 95% | < 10−39 |
| VegBank | 141 | 0.971 | 0.915 | 96% | < 10−21 | |
| BLM AIM | 104 | 0.938 | 0.845 | 94% | < 10−16 | |
| USFS FIA | 14 | 0.972 | 0.915 | 100% | 0.00012 | |
| All plots, > 10 km from records | 255 | 0.931 | 0.878 | 85% | < 10−29 | |
| VegBank, > 10 km | 138 | 0.937 | 0.903 | 82% | < 10−13 | |
| BLM AIM, > 10 km | 103 | 0.905 | 0.821 | 86% | < 10−14 | |
| USFS FIA, > 10 km | 14 | 0.942 | 0.900 | 100% | 0.00012 |
Median AUC; a test is one species on one plot source; p: Wilcoxon signed-rank, paired, two-sided. Distance to records: plots more than 10 km from every training record of the species. BIEN on VegBank and FIA is left out (not independent). Per-test AUCs: work/benchmark/vs_sinr/cards_ringpot_full_shore_maxent240.csv.
Against Daru (2024) on every species with a published map. 0.960 vs 0.896, higher for 96% of 259 tests (190 species).
| Plots | Tests | DeepEarth | Daru | Higher for | p |
|---|---|---|---|---|---|
| All plots | 259 | 0.960 | 0.896 | 96% | < 10−39 |
| VegBank | 141 | 0.971 | 0.910 | 96% | < 10−21 |
| BLM AIM | 104 | 0.938 | 0.853 | 95% | < 10−16 |
| USFS FIA | 14 | 0.972 | 0.916 | 100% | 0.00012 |
Median AUC; a test is one species on one plot source; p: Wilcoxon signed-rank, paired.
Against per-species MaxEnt on every species with both maps. 0.963 vs 0.934, higher for 92% of 2,251 tests (1,651 species).
| Plots | Tests | DeepEarth | MaxEnt | Higher for | p |
|---|---|---|---|---|---|
| All plots | 2,251 | 0.963 | 0.934 | 92% | < 10−299 |
| VegBank | 1,547 | 0.966 | 0.938 | 94% | < 10−223 |
| BLM AIM | 480 | 0.943 | 0.906 | 89% | < 10−53 |
| USFS FIA | 224 | 0.949 | 0.935 | 87% | < 10−25 |
Median AUC; a test is one species on one plot source; p: Wilcoxon signed-rank, paired.
Accuracy by number of training records. Median AUC stays at or above 0.92 from fewer than 50 to 5,000 records.
Species with few or no records. 5 records: 0.927 vs 0.895 for MaxEnt.
Plots over 10 km from any training record (VegBank test half): joint 0.941, MaxEnt 0.917.
Storage. 9.8 GB for all maps; median AUC 0.972 before storage and 0.971 after.
Speed. 16,448 species fitted in 1848 seconds; MaxEnt in PyTorch: 7–8× faster fitting, 263 million cells per second.
Equations and code. The model, its training objective, the evaluation and the map store, each linked to the code that computes it.
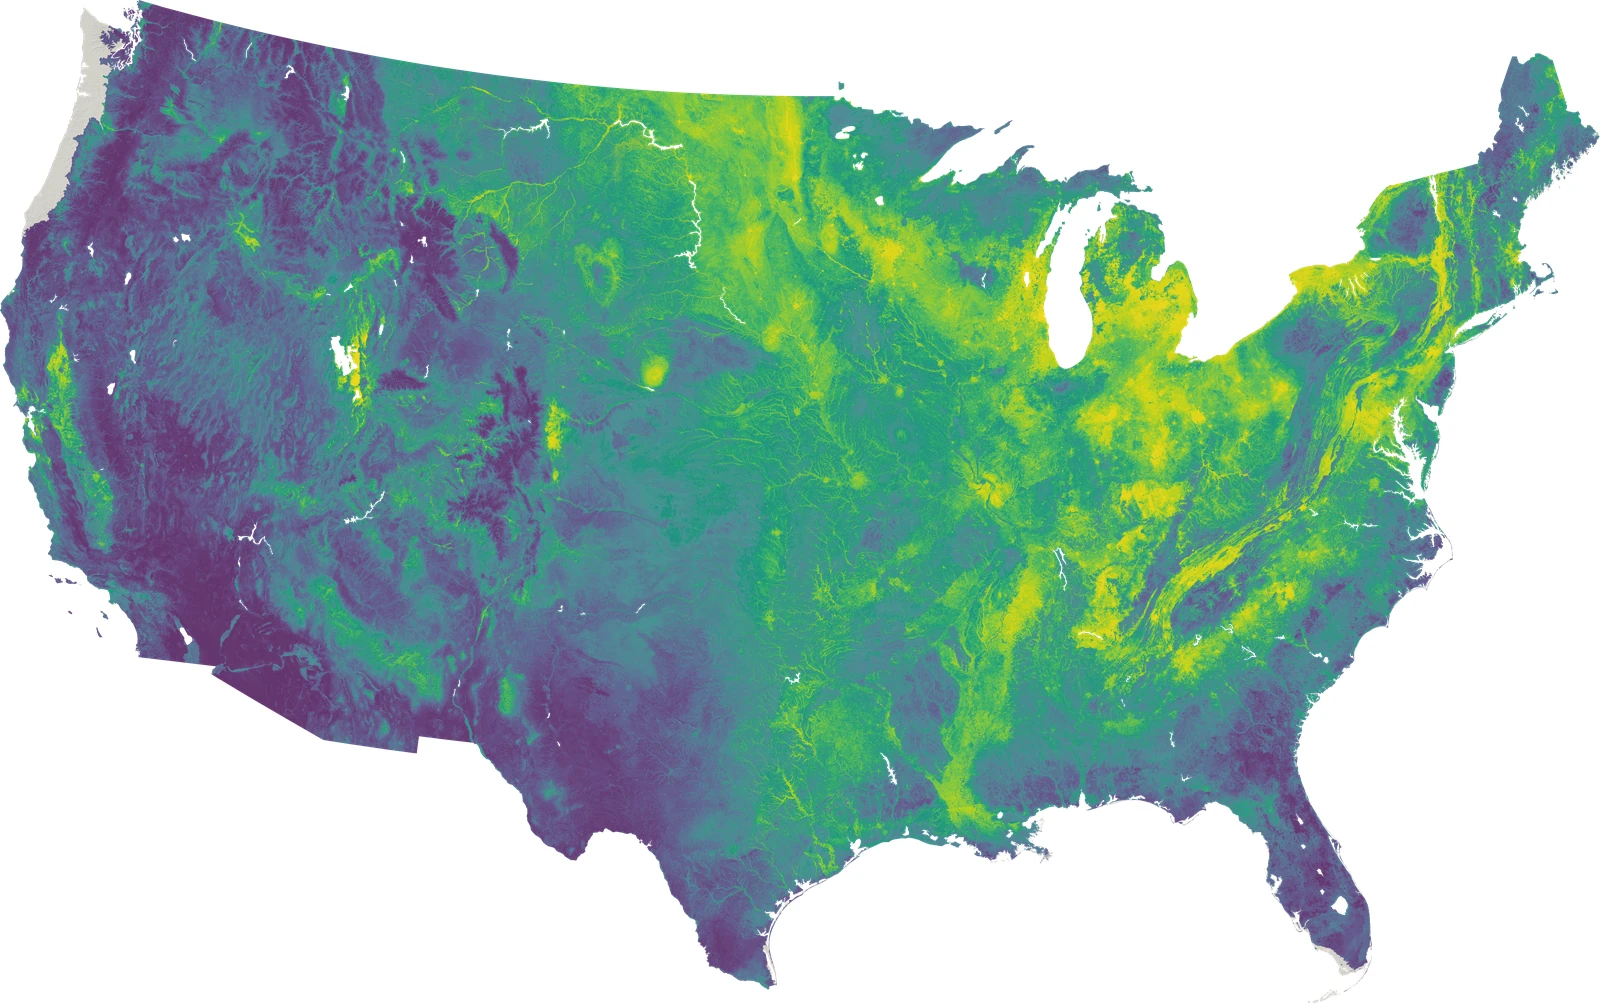
Figure 8. Acer negundo, joint model, contiguous United States at 240 m. 1 of 16,942 species distributions modeled by DeepEarth.